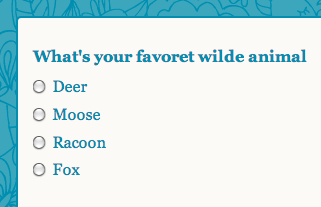
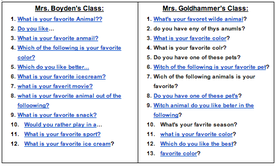
First and Second graders in Mrs. Boyden and Mrs. Goldhammer's classes have been studying REPRESENTATIONS in Math class. To go along with this study, we decided to introduce them to Google Forms. Within Google Forms, each student was able to ask a question. The guidelines were: write a multiple choice question; one question, four options.
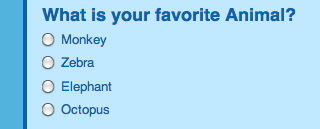
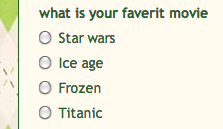
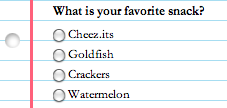
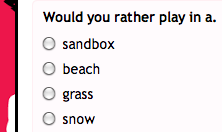
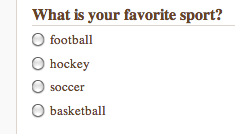
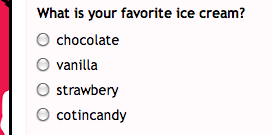
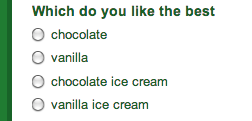
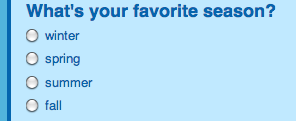
Below are just some examples of what students thought worthy of asking:
Below are just some examples of what students thought worthy of asking:

Next, it was time to spread the word and crunch the numbers. Mrs. Boyden and Mrs. Goldhammer asked families to fill out the surveys via classroom blog. Ms. Schlageter tweeted the link, and Mr. Berthiaume shared the project at the School Board meeting. Most students had 30+ responses!
When a Google Form is created, answers are collected in a spreadsheet. Each row holds someone's answer. First and second graders learned to tell the difference between their survey and spreadsheet. They "viewed the summary of results" which looked like a pie (or pizza) chart. They copied the data down onto their recording sheet so they could make yet another representation.
When a Google Form is created, answers are collected in a spreadsheet. Each row holds someone's answer. First and second graders learned to tell the difference between their survey and spreadsheet. They "viewed the summary of results" which looked like a pie (or pizza) chart. They copied the data down onto their recording sheet so they could make yet another representation.
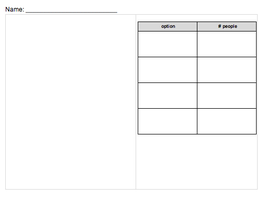 sample "data sheet" | |

click here to see data representations
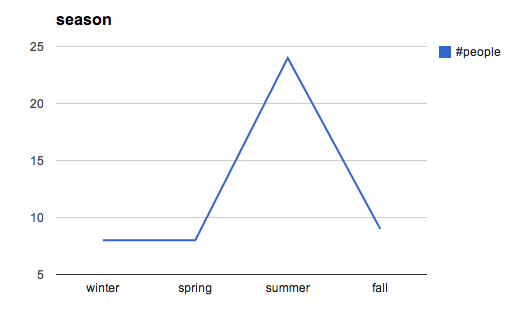
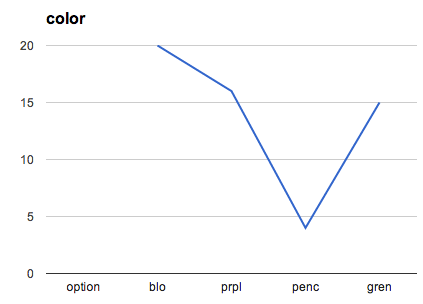
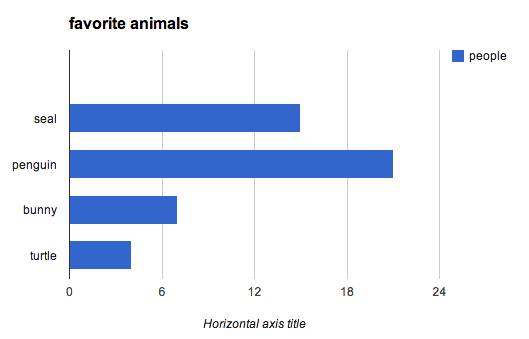
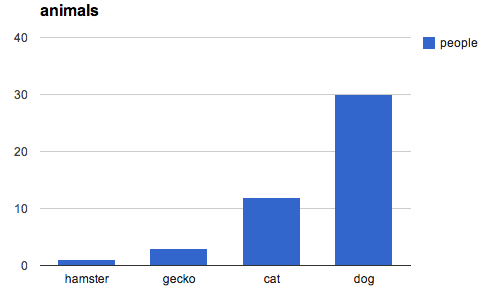
The final step was to insert a chart. This time, students could choose between the different representations Google Spreadsheets offers; bar chart, column chart, line chart or scatter chart. Each student was also able to name their chart.
It was really exciting seeing which option got the most votes and which got the fewest. It was also interesting to discuss why this might be and what variables may have influenced the audience's answers! Who knew data could be this much fun?!
It was really exciting seeing which option got the most votes and which got the fewest. It was also interesting to discuss why this might be and what variables may have influenced the audience's answers! Who knew data could be this much fun?!

 RSS Feed
